Product Definition and Strategy
The RepairPal Shop and Data team was given a very broad directive to develop a new “vehicle ownership” product for the consumer website. The goal was to expand company product offerings in order to drive new website traffic, as existing RepairPal products focused primarily on vehicle repair.
In the early stages of the project, Ownership evolved into a uniquely useful consumer research tool known as Vehicle Reliability.
Product strategy aimed to to differentiate our product from the competition by leveraging our substantial proprietary database, which included tens of thousands of vehicle repair invoices.
Solution
Arm consumers with ratings based on objective, real data, so that they can confidently make informed decisions for their car ownership experience
Form an emotional connection with the user by addressing one of the most anxiety-producing aspects of vehicle ownership – reliability
Develop a highly accurate Reliability score algorithm broken into three components – cost, frequency and severity of repairs
Make data easily digestible by providing both at-a-glance and drill-down experiences in a clean UI
Make vehicle comparative research easy and delightful. See the reliability car comparison project.
Impact
A search for “car reliability” now ranks RepairPal’s reliability page third in Google search results, behind companies with significant domain authority – Consumer Reports and U.S. News and World Report. Traffic to the nearly 300 make/model Reliability pages, car make pages and car segment (e.g. Compact Car) continues to increase.
My role: All design discovery and research, user interviews, UX design, user testing and visual design. The product concept was developed in collaboration with a product manager and data engineers.
Process
1. Competitive analysis
I began by doing competitive analysis of companies whose sites featured car ownership data and infographics.
Some of these included:
Consumer Reports
U.S. News and World Report
J.D.Power
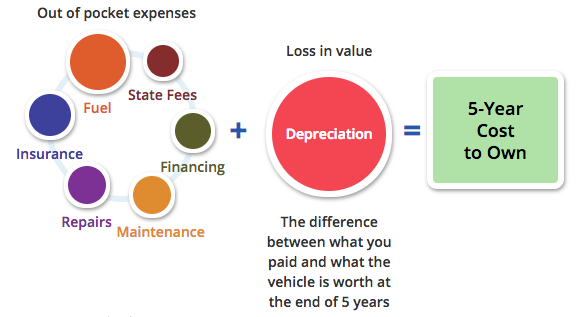
Edmunds – True Cost to Own®
Kelley Blue Book – 5-Year Cost to Own
CarMD – Vehicle Health Index
Findings
An overwhelming majority of this information revolved around the cost of financing, depreciation, repairs, maintenance, fuel, fees, fuel and insurance. There is a large amount of data out there available to compile these cost reports.
Additionally, RepairPal does not have data on insurance, financing and depreciation. They do, however, have a massive database of tens of thousands of repair invoices from independent repair shops across all 50 states.
2. Consumer Research
Interviews
I conducted approximately a dozen in-person interviews with consumers. Participants were shown mockups with large car images and various types of graphs and data visualization (using fictitious data) as a conversation starter – something to look at and react do as a series of questions guided the conversation. They were asked broad questions about the following:
General concerns such as cost of ownership
Repair shop experiences
Car buying experiences
Car research tools and methods
How long they typically kept cars
Other motivations behind their buying and ownership behaviors
Interview takeaways
Use of large car images creates a much stronger connection with the page content and design than when small or no images are used
Users typically fall into one of two primary categories (sometimes with overlap) – the Owner and the Researcher/Prospective Buyer.
Most participants expressed concerns about cost, regardless of whether they were seeking information on a car they owned or a car (or cars) they were researching for purchase.
How does owning vs. researching a car affect what data users want to see?
Example of one of my early mocks – intentionally high-fidelity, with fictitious data, to encourage interview participants to react and talk freely
Personas
A. The Car Owner
This person is seeking information on a specific car they already own, either for maintenance and repair planning, or pure curiosity.
B. The Car Buyer / Researcher
This person is seeking information on one or more cars while researching a purchase, and may be more open to organic discovery through related content. The ability to compare vehicles may prove valuable.
Refined Product Definition and Strategy
In addition to cost issues, interview participants frequently referenced dependability and reliability. This struck me as a key component to hone in on while defining our new product concept. It was more specific and emotionally resonant than the more vague “cost to own” that so many other websites focused on.
3. More Competitive Analysis – “Reliability” rankings that weren’t so reliable
With a refined product concept revolving around vehicle reliability, I returned to competitive analysis. What I discovered is that when companies with household names and significant domain authority – Consumer Reports, U.S. News, J.D. Power – ranked cars on dependability and reliability, their rankings were based not on objective data but simply on subjective consumer surveys given to owners of various vehicle models. Brand loyalty and other factors could certainly skew these results significantly.
This is where we saw our chance to create a unique product that would differentiate RepairPal from other available consumer tools – create a reliability rating based entirely on hard data, not on subjective and variable consumer opinions!
4. “It’s all about the data” – A fact-based reliability rating
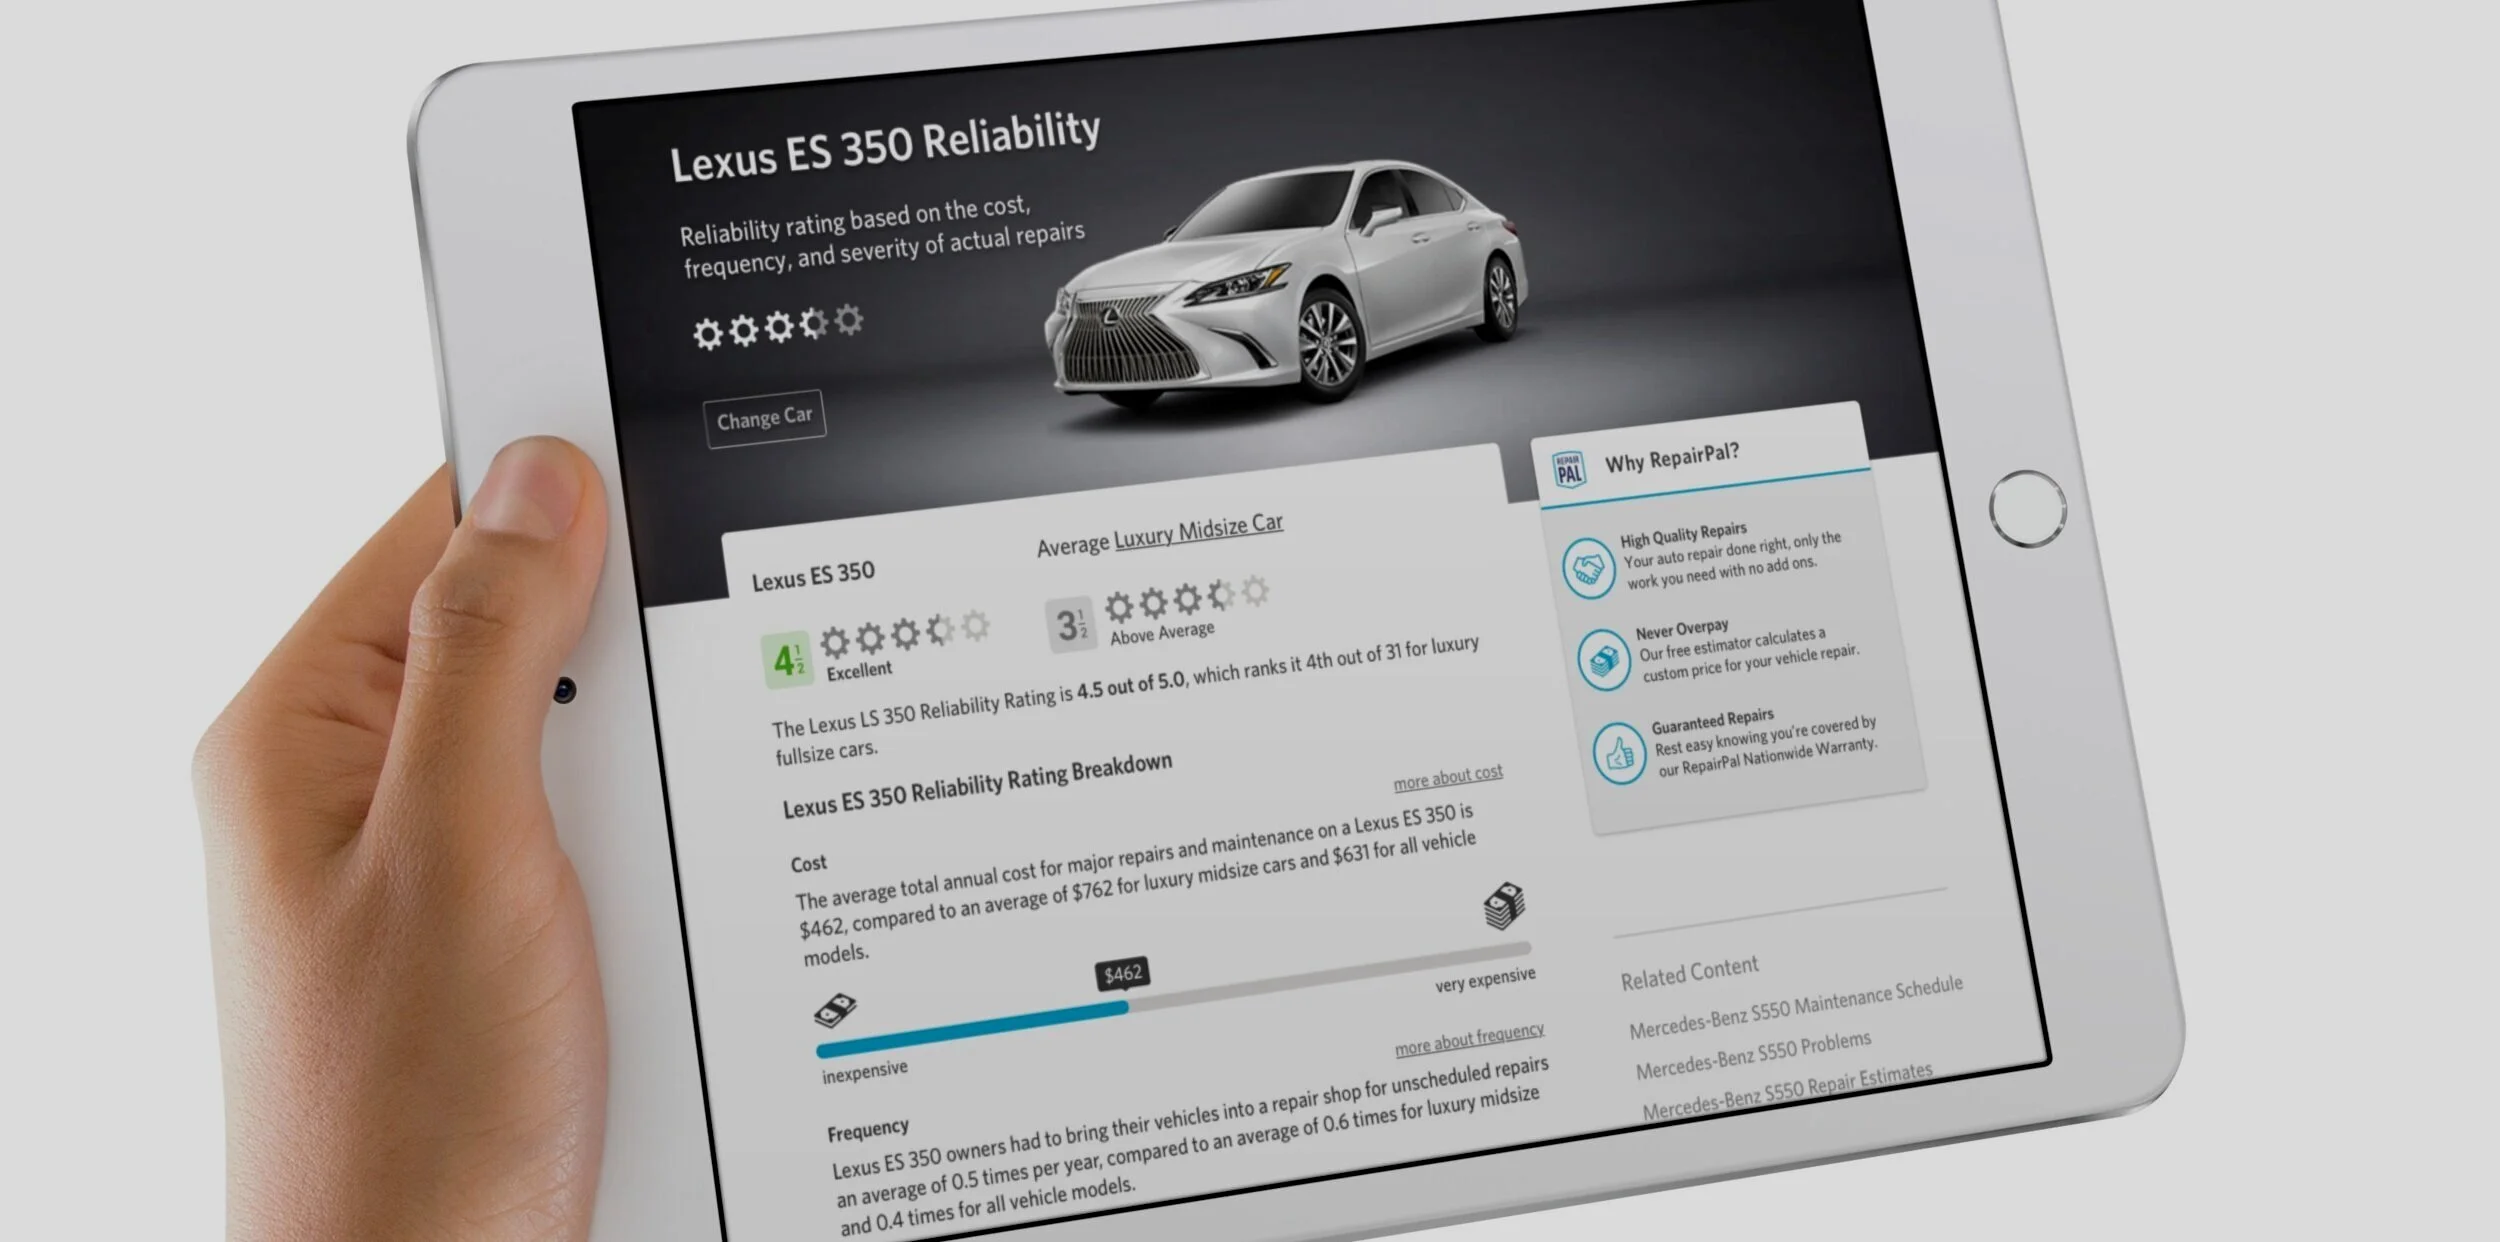
Defining a Reliability Score and score algorithm components
We got to work leveraging RepairPal’s vast database tens of thousands of car repair invoices from independent shops across the nation.
Expanding on concepts drawn from interviews and research, a product manager and I defined 3 components which would comprise the reliability rating. After many whiteboard sessions and debates around the most descriptive and user-friendly nomenclature, these 3 factors were defined as:
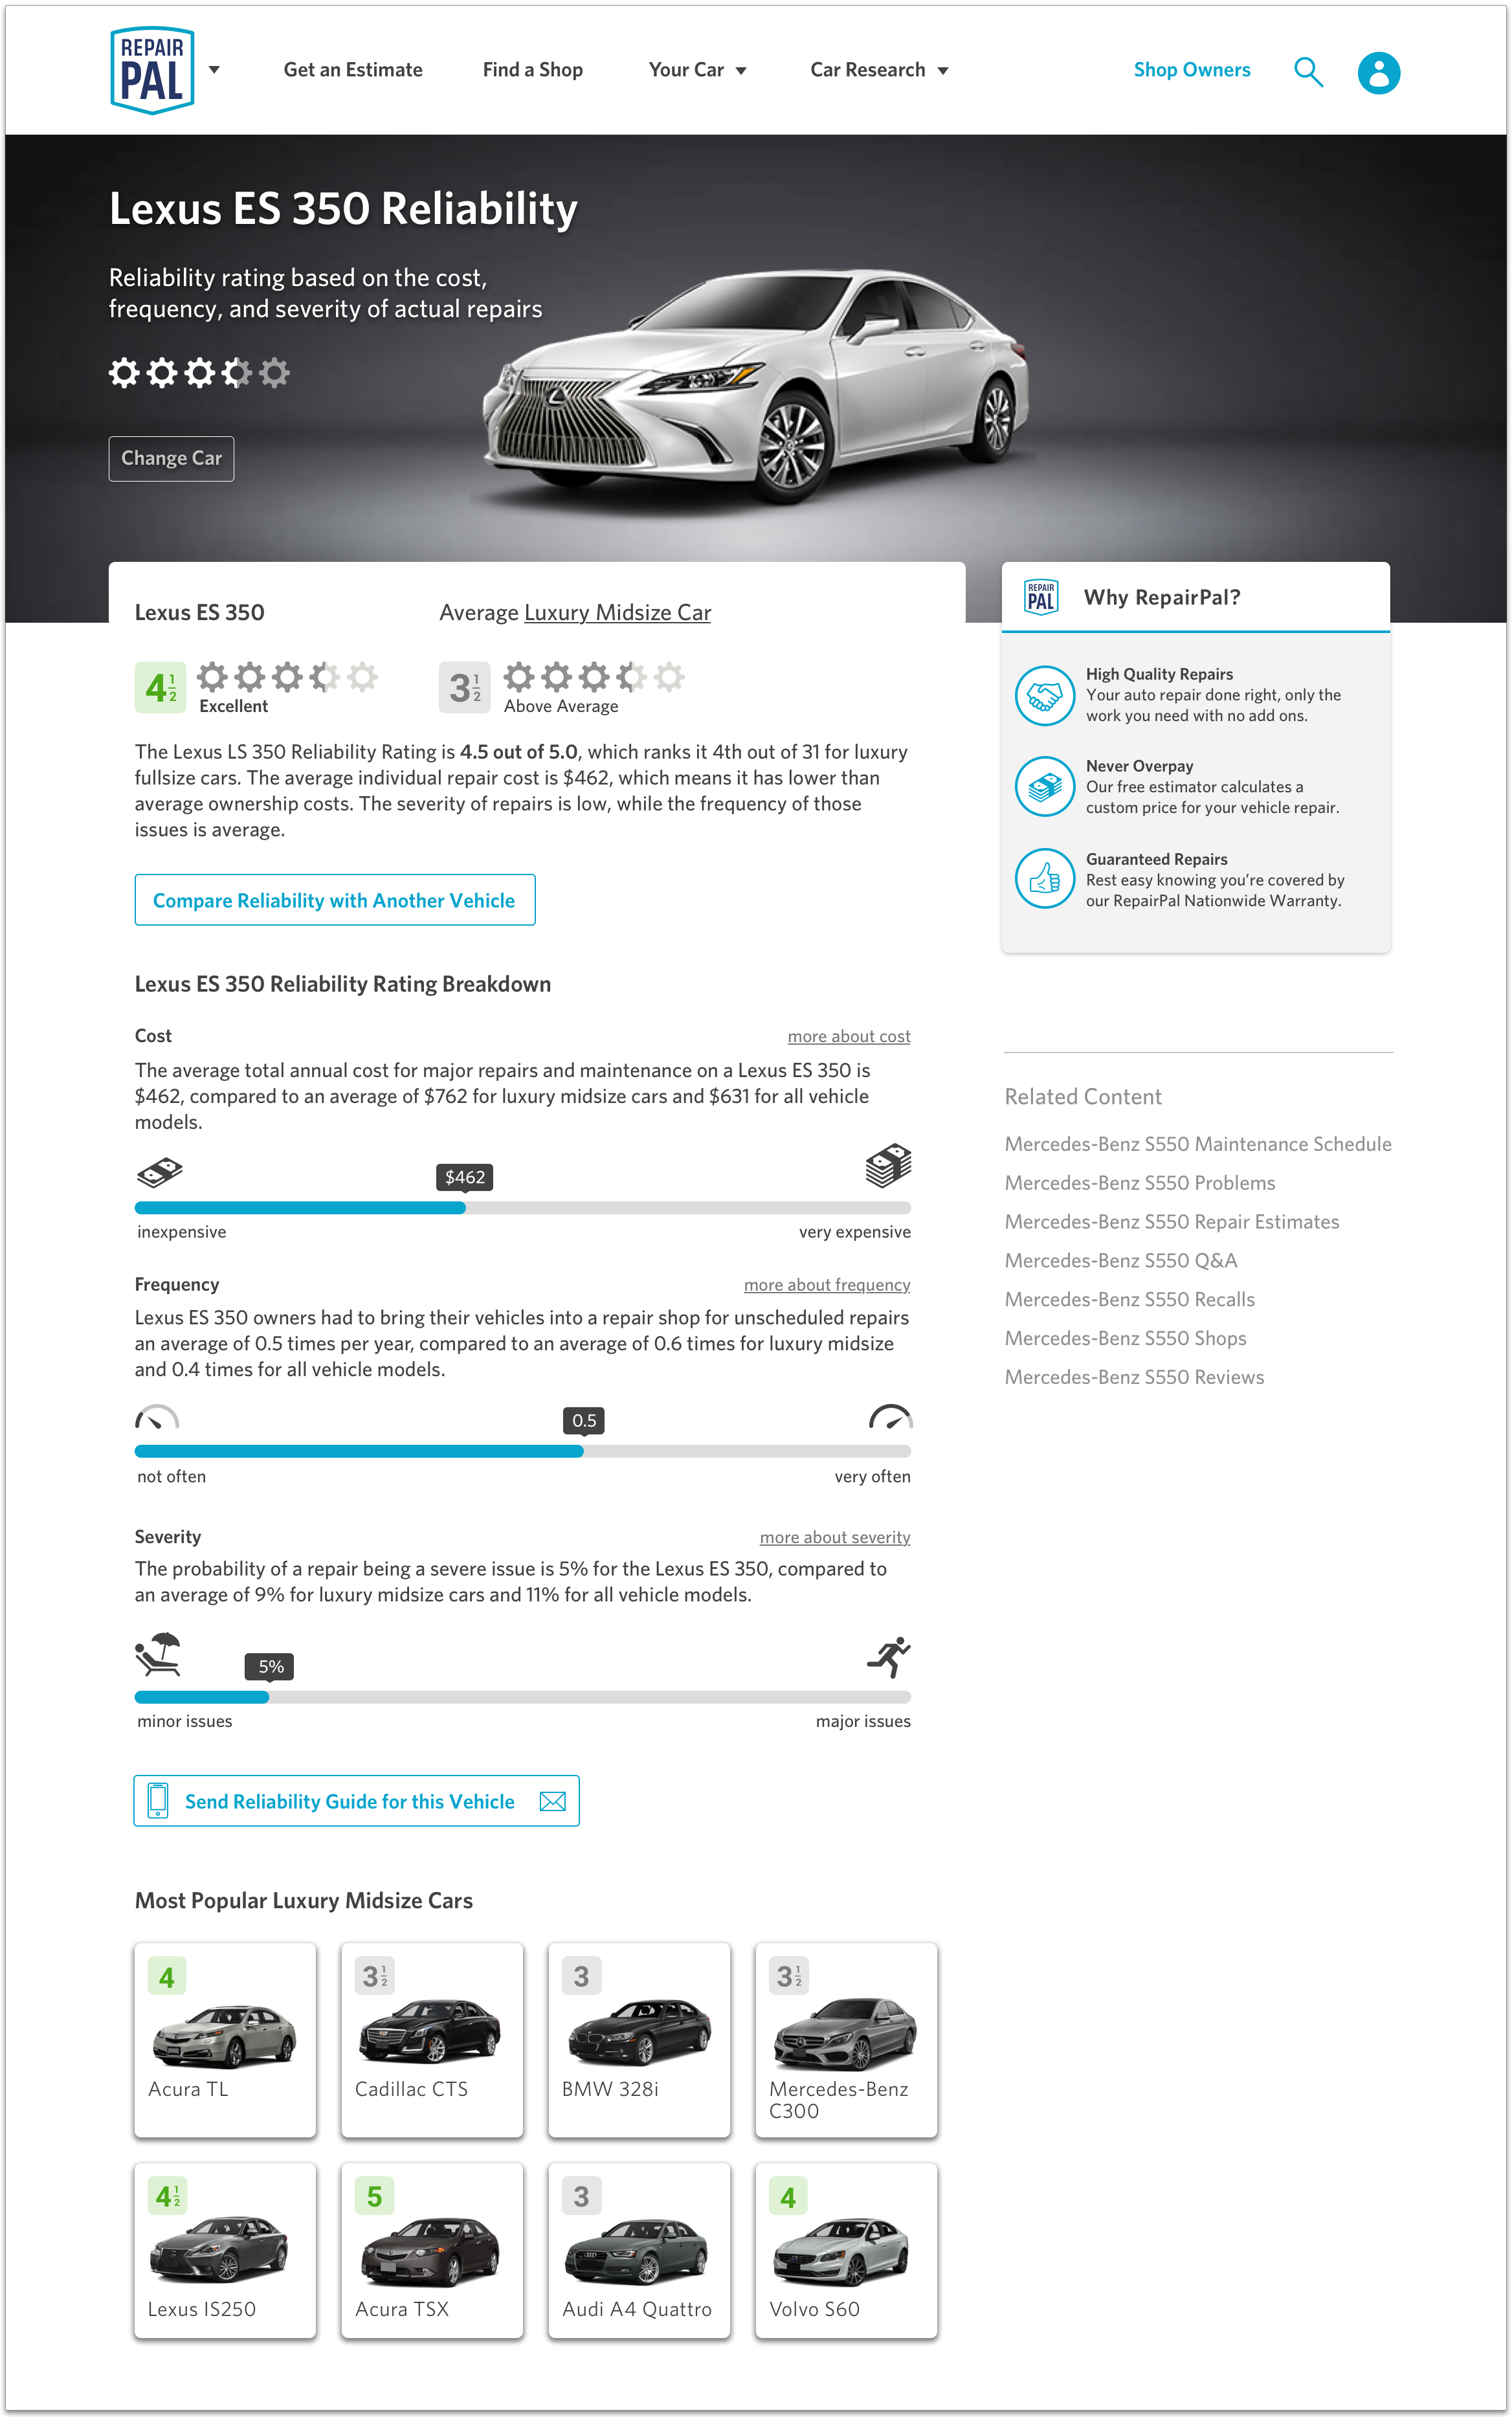
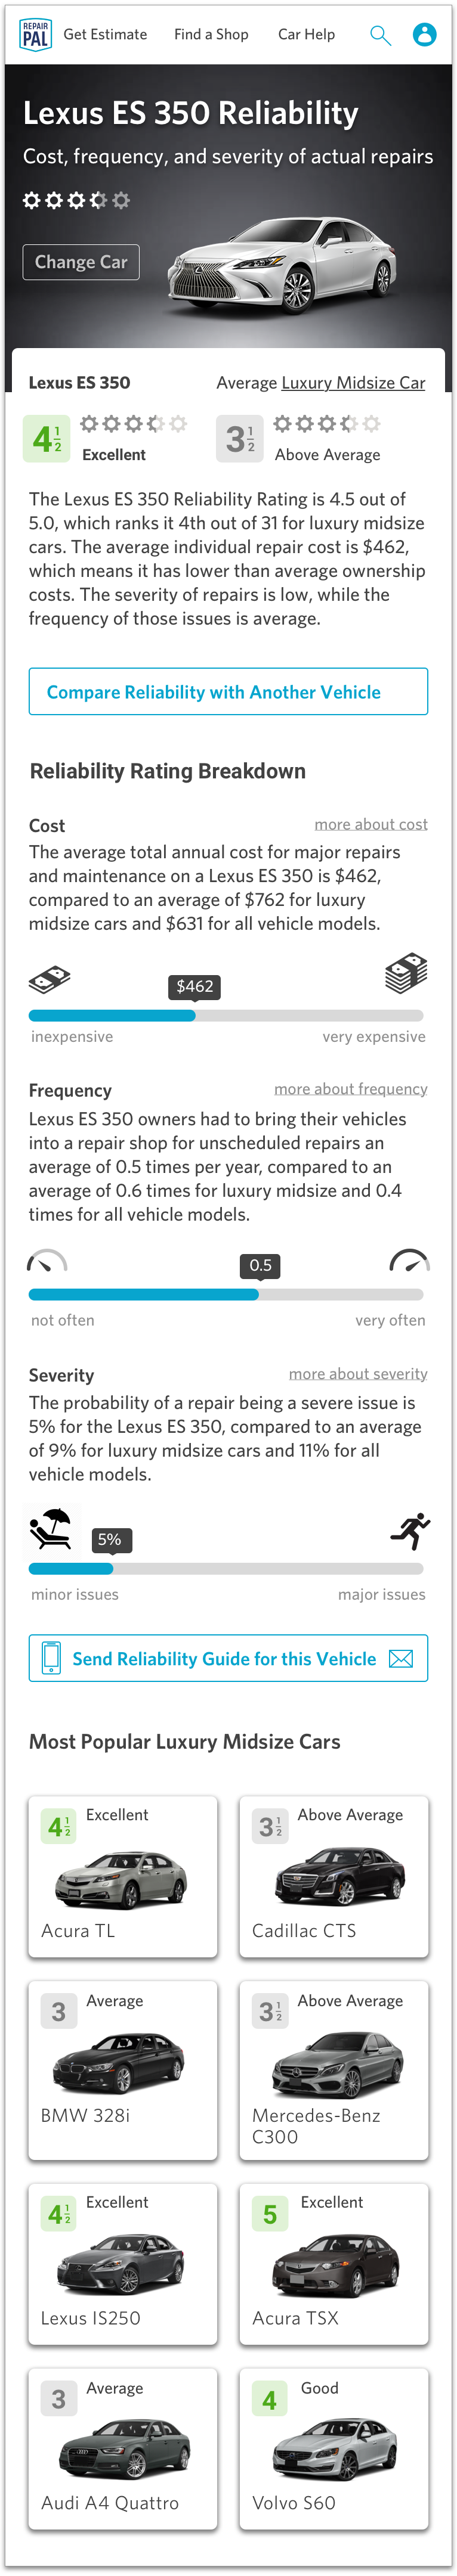
Cost – the average total annual cost for repairs and maintenance
Frequency – the average number of times a vehicle is brought into the shop for unscheduled repairs and maintenance in a single year
Severity – the probability that a repair will be a major issue, meaning, if the repair requires immediate service, is prohibitively expensive or presents a potentially dangerous or damage-causing situation.
We worked with data engineers to ensure that we had sufficient data points for each model we rated to ensure the accuracy of our scores.
From there, we did many iterations on the relative weight of each component, and the method for calculating each component. We sought a finely tuned algorithm which yielded results that made sense and took into account such things as a wide range in the cost of OEM parts.
5. Design
Data Visualization
Reliability would include multiple page types (each with unique needs for data visualization)
An index page and general overview of vehicle reliability
Make-only pages (vehicle brand – e.g. Subaru)
Segment pages (car type – e.g. compact car)
Make/Model pages (e.g. Ford Explorer), likely to be the most useful tool for consumers
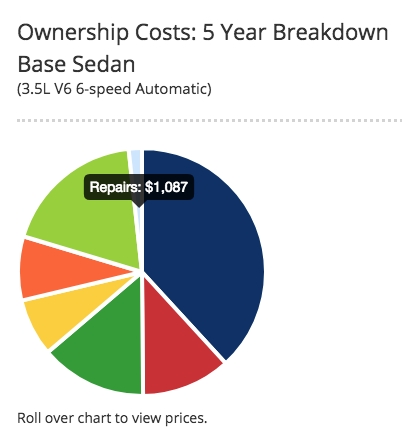
I explored a multitude of chart types (a few shown below), as well as ways of displaying related content, looking for ways to pique user interest while maximizing SEO.
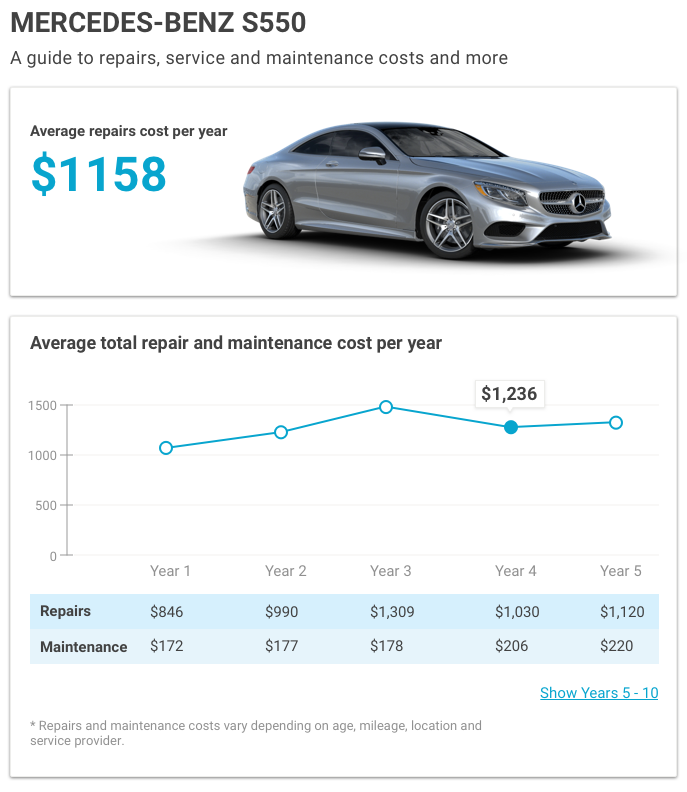
Previously, I had designed a product called the Repair Cost Index Score. The product and back-end data were adapted to become the Cost component of Reliability. Certain UI elements informed the Reliability interface and were given a fresh visual update.
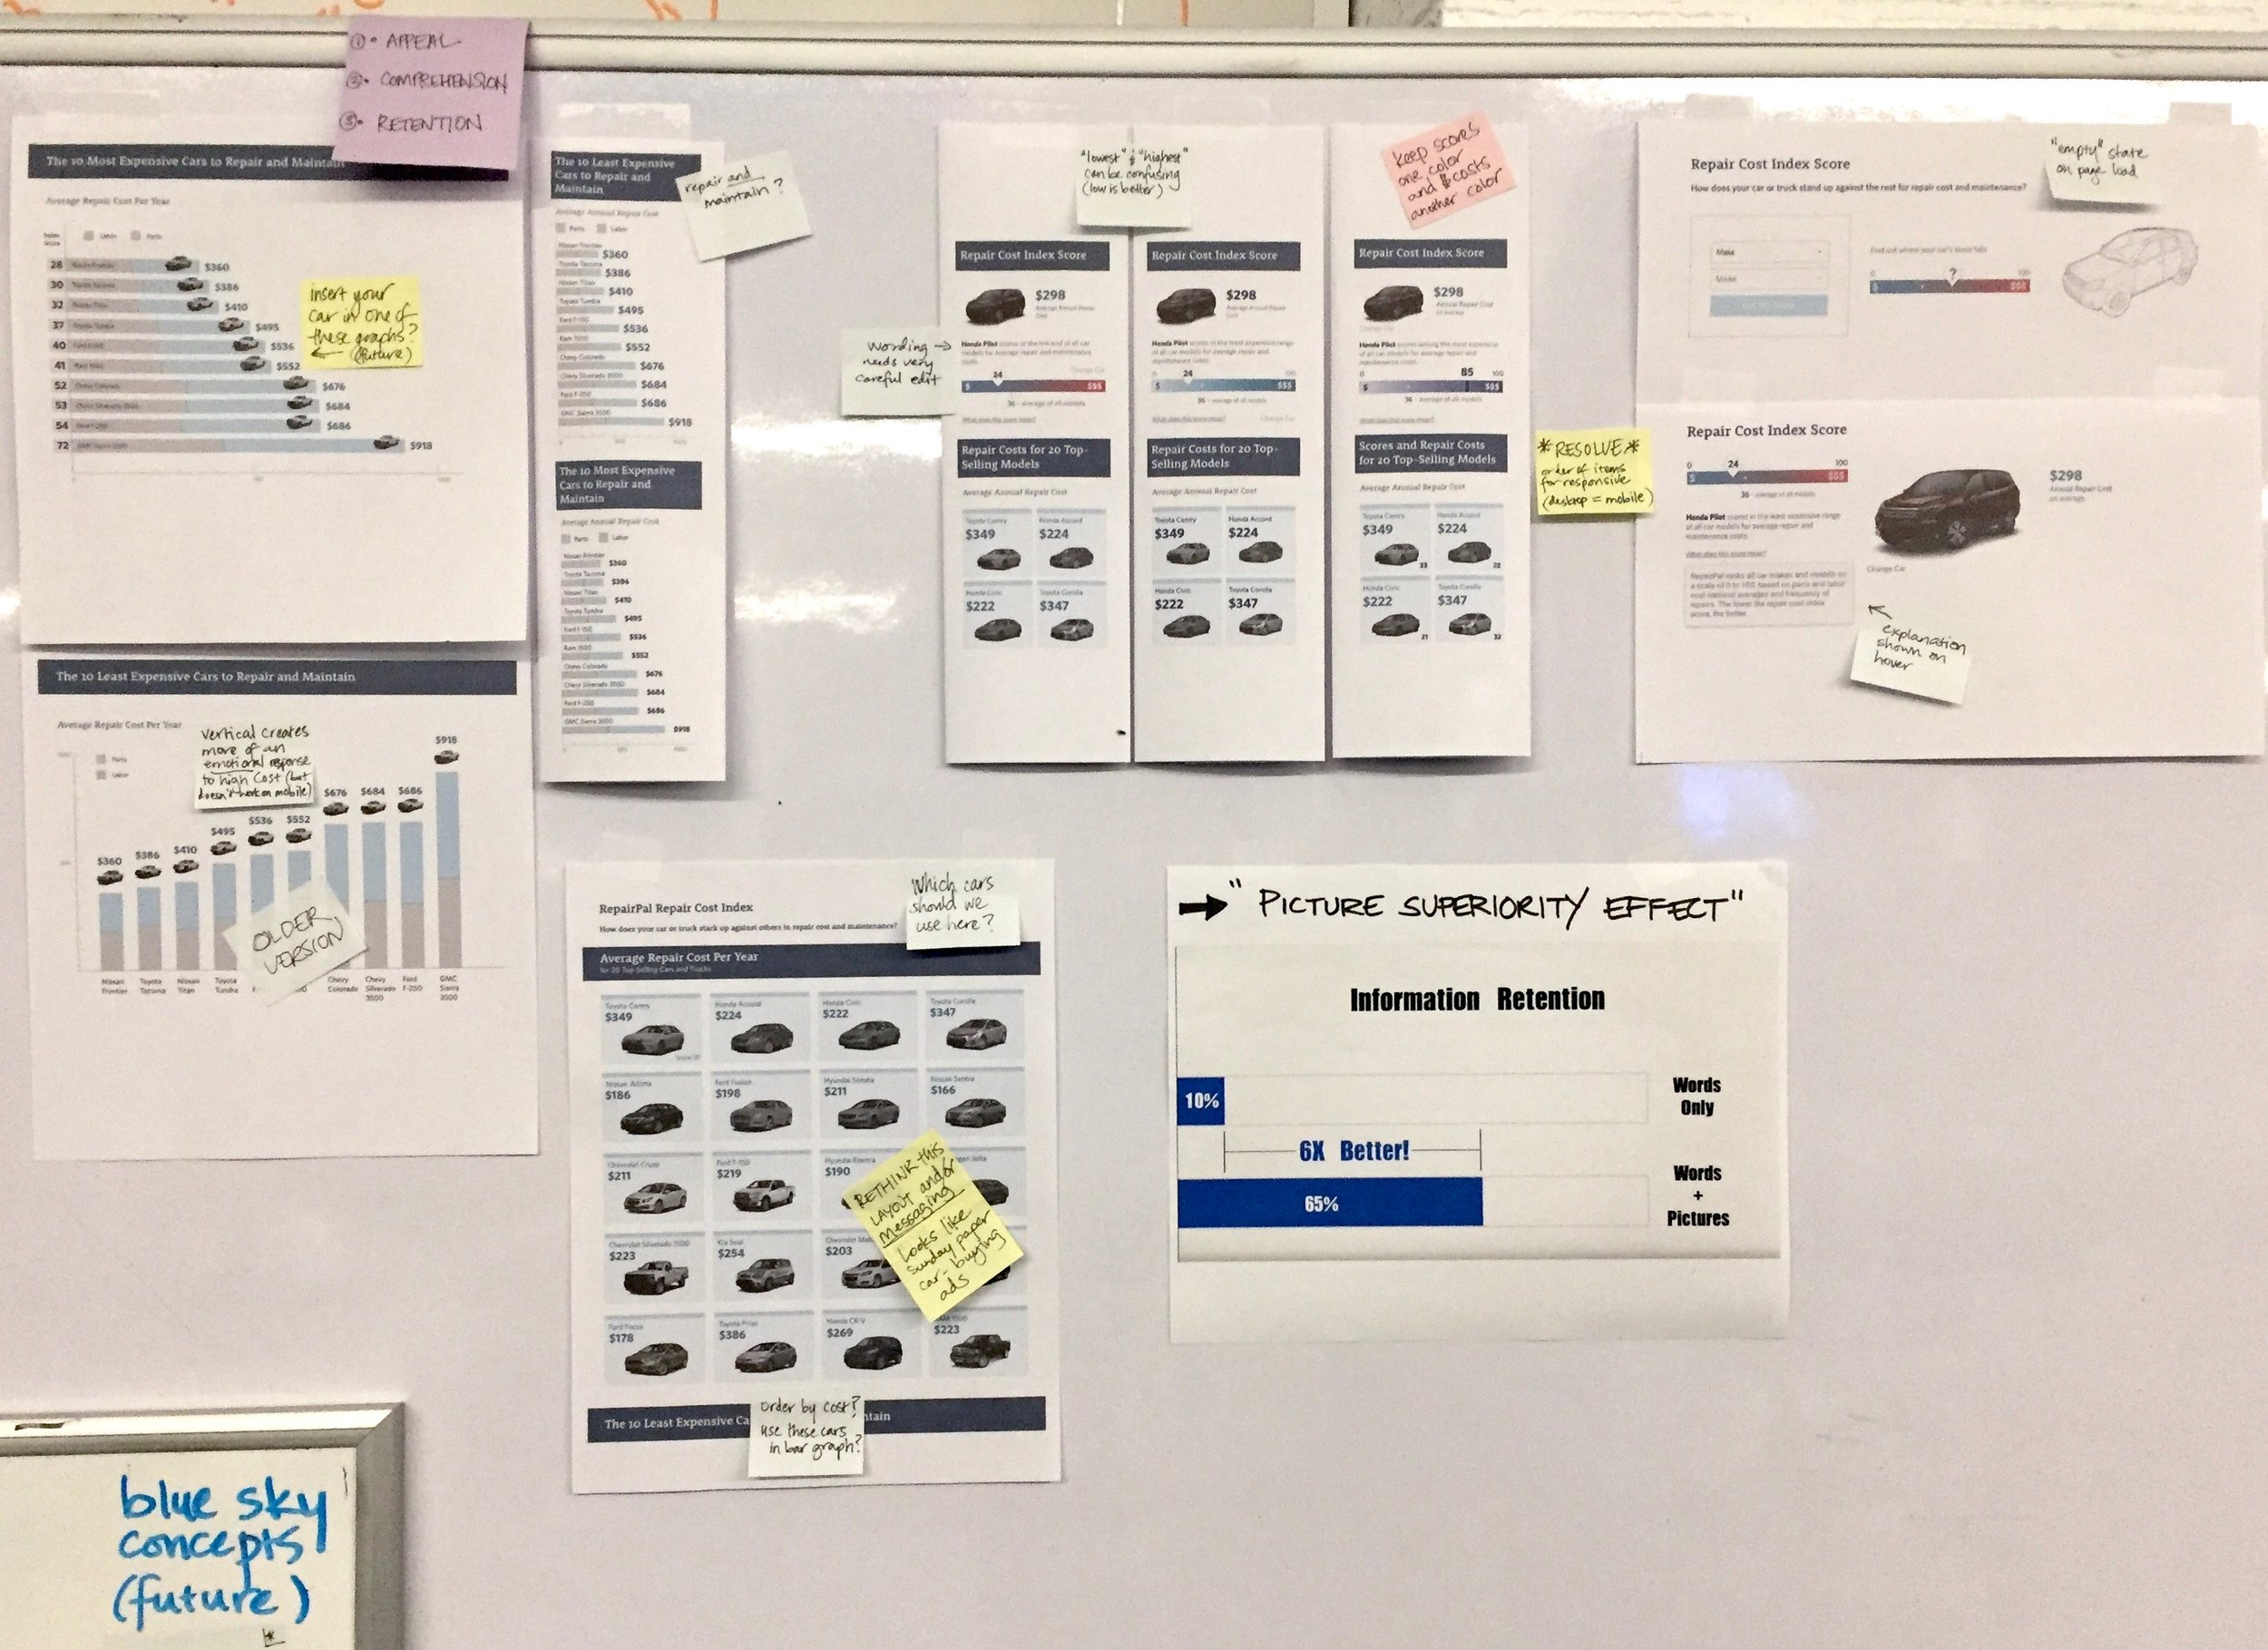
Various graphs and data visualization, taped up on the board for discussion with the team during product development
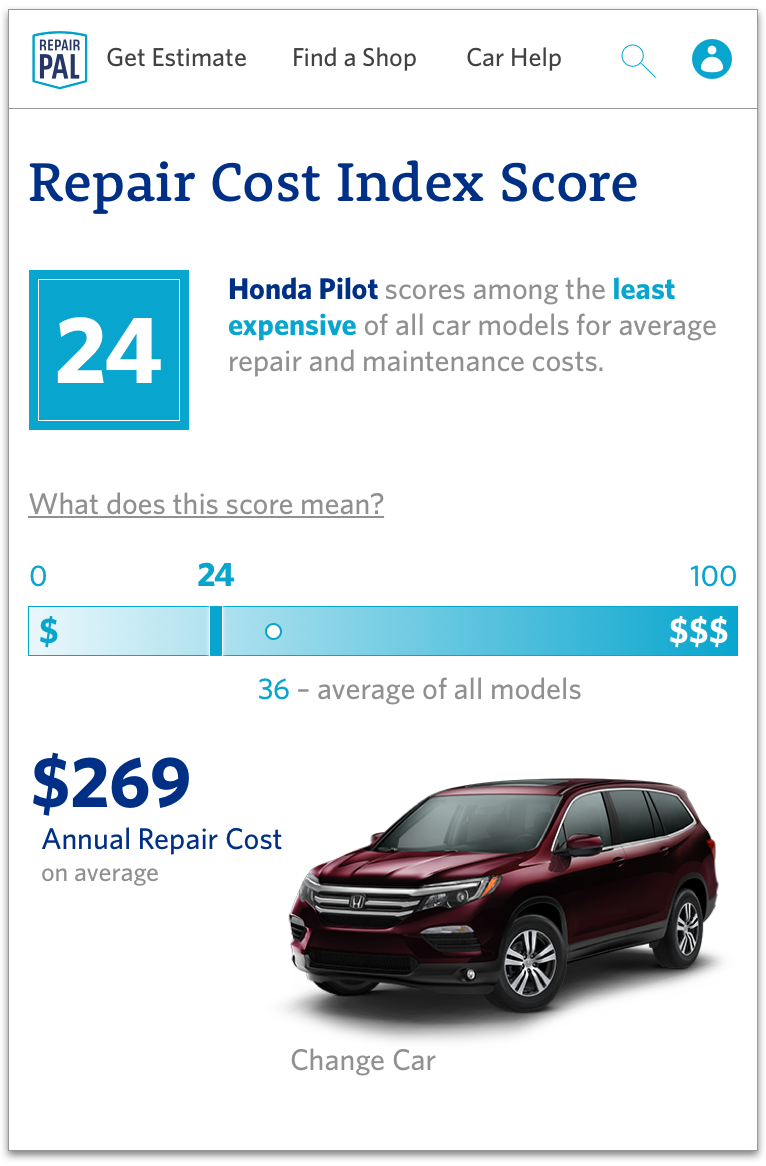
Revisiting UI and back-end data from a previous project – Repair Cost Index Score
User interface and visual icons
The use of car dashboard gauges and obvious stoplight icons felt overdone and overly literal on many automotive websites, so I explored other options for the top-level scoring visuals of Reliability. The “score card” concept from Repair Cost Index Score (above) was revisited and evolved into a Reliability score card with corresponding rating labels. Color-coding was incorporated to aid comprehension and subtly elicit an emotional response, but I avoided the use of yellow with a more abstract adaptation of stoplight colors.
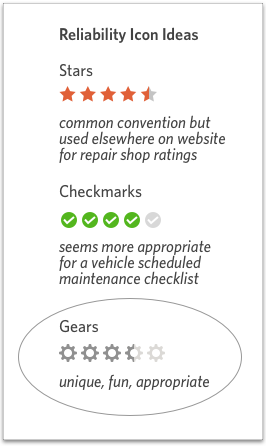
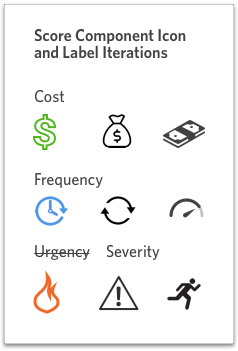
For an easily understood ‘0 to 5’ reliability rating icon in 1/2-unit increments, a group of us gathered to spitball ideas and discuss existing scoring icons used on other websites, such as Yelp. We decided upon gears, as this symbol was particularly relevant to the mechanical operation of a car.
Wireframes – evolution of content organization and UI for the primary page type
Content chunking in low-fidelity schematic
Iteration with single icon for each component and score-dependent witticisms beneath bar graphs
Iteration with two monochrome icons for each component
6. User testing and design iterations
Throughout the wireframe and mockup iteration phase, user testing was conducted online, in the office with coworkers and out of the office with friends. Mobile mocks were always shown on mobile devices.
Feedback topics
Content organization and layout
Clarity of UX writing
Legibility on mobile devices
Data visualization effectiveness
Emotional connection with car imagery, icons and overall visual design
Findings and final design decisions
Information hierarchy – Prioritize important data. 1. Gut level snapshot, 2. Detailed breakdown, 3. Highly clickable cards with links to similar vehicles
Dramatic car imagery – make the primary car image at the top appear as though it is spotlighted on a showroom floor for the most emotional appeal. Maximize size without pushing content too far down the page.
Limit the color palette to minimize distraction, so that any use of unique colors emphasized associated content. Align secondary information with existing consumer site style guide.
Lighten the mood with icons and copy in the reliability breakdown section. Many people are stressed out about the cost and inconvenience of major car repairs. In one design iteration that I tested, I went “far out of the box” of the typical RepairPal tone and explored the use of witticisms in the copy under the breakdown graphs. Users responded quite positively during testing. Ultimately I had to compromise with the more conservative tone of our brand.
However, given that severity was the area of highest stress amongst users, I did manage to get my fun Severity icons into the shipped product!


Final Mocks
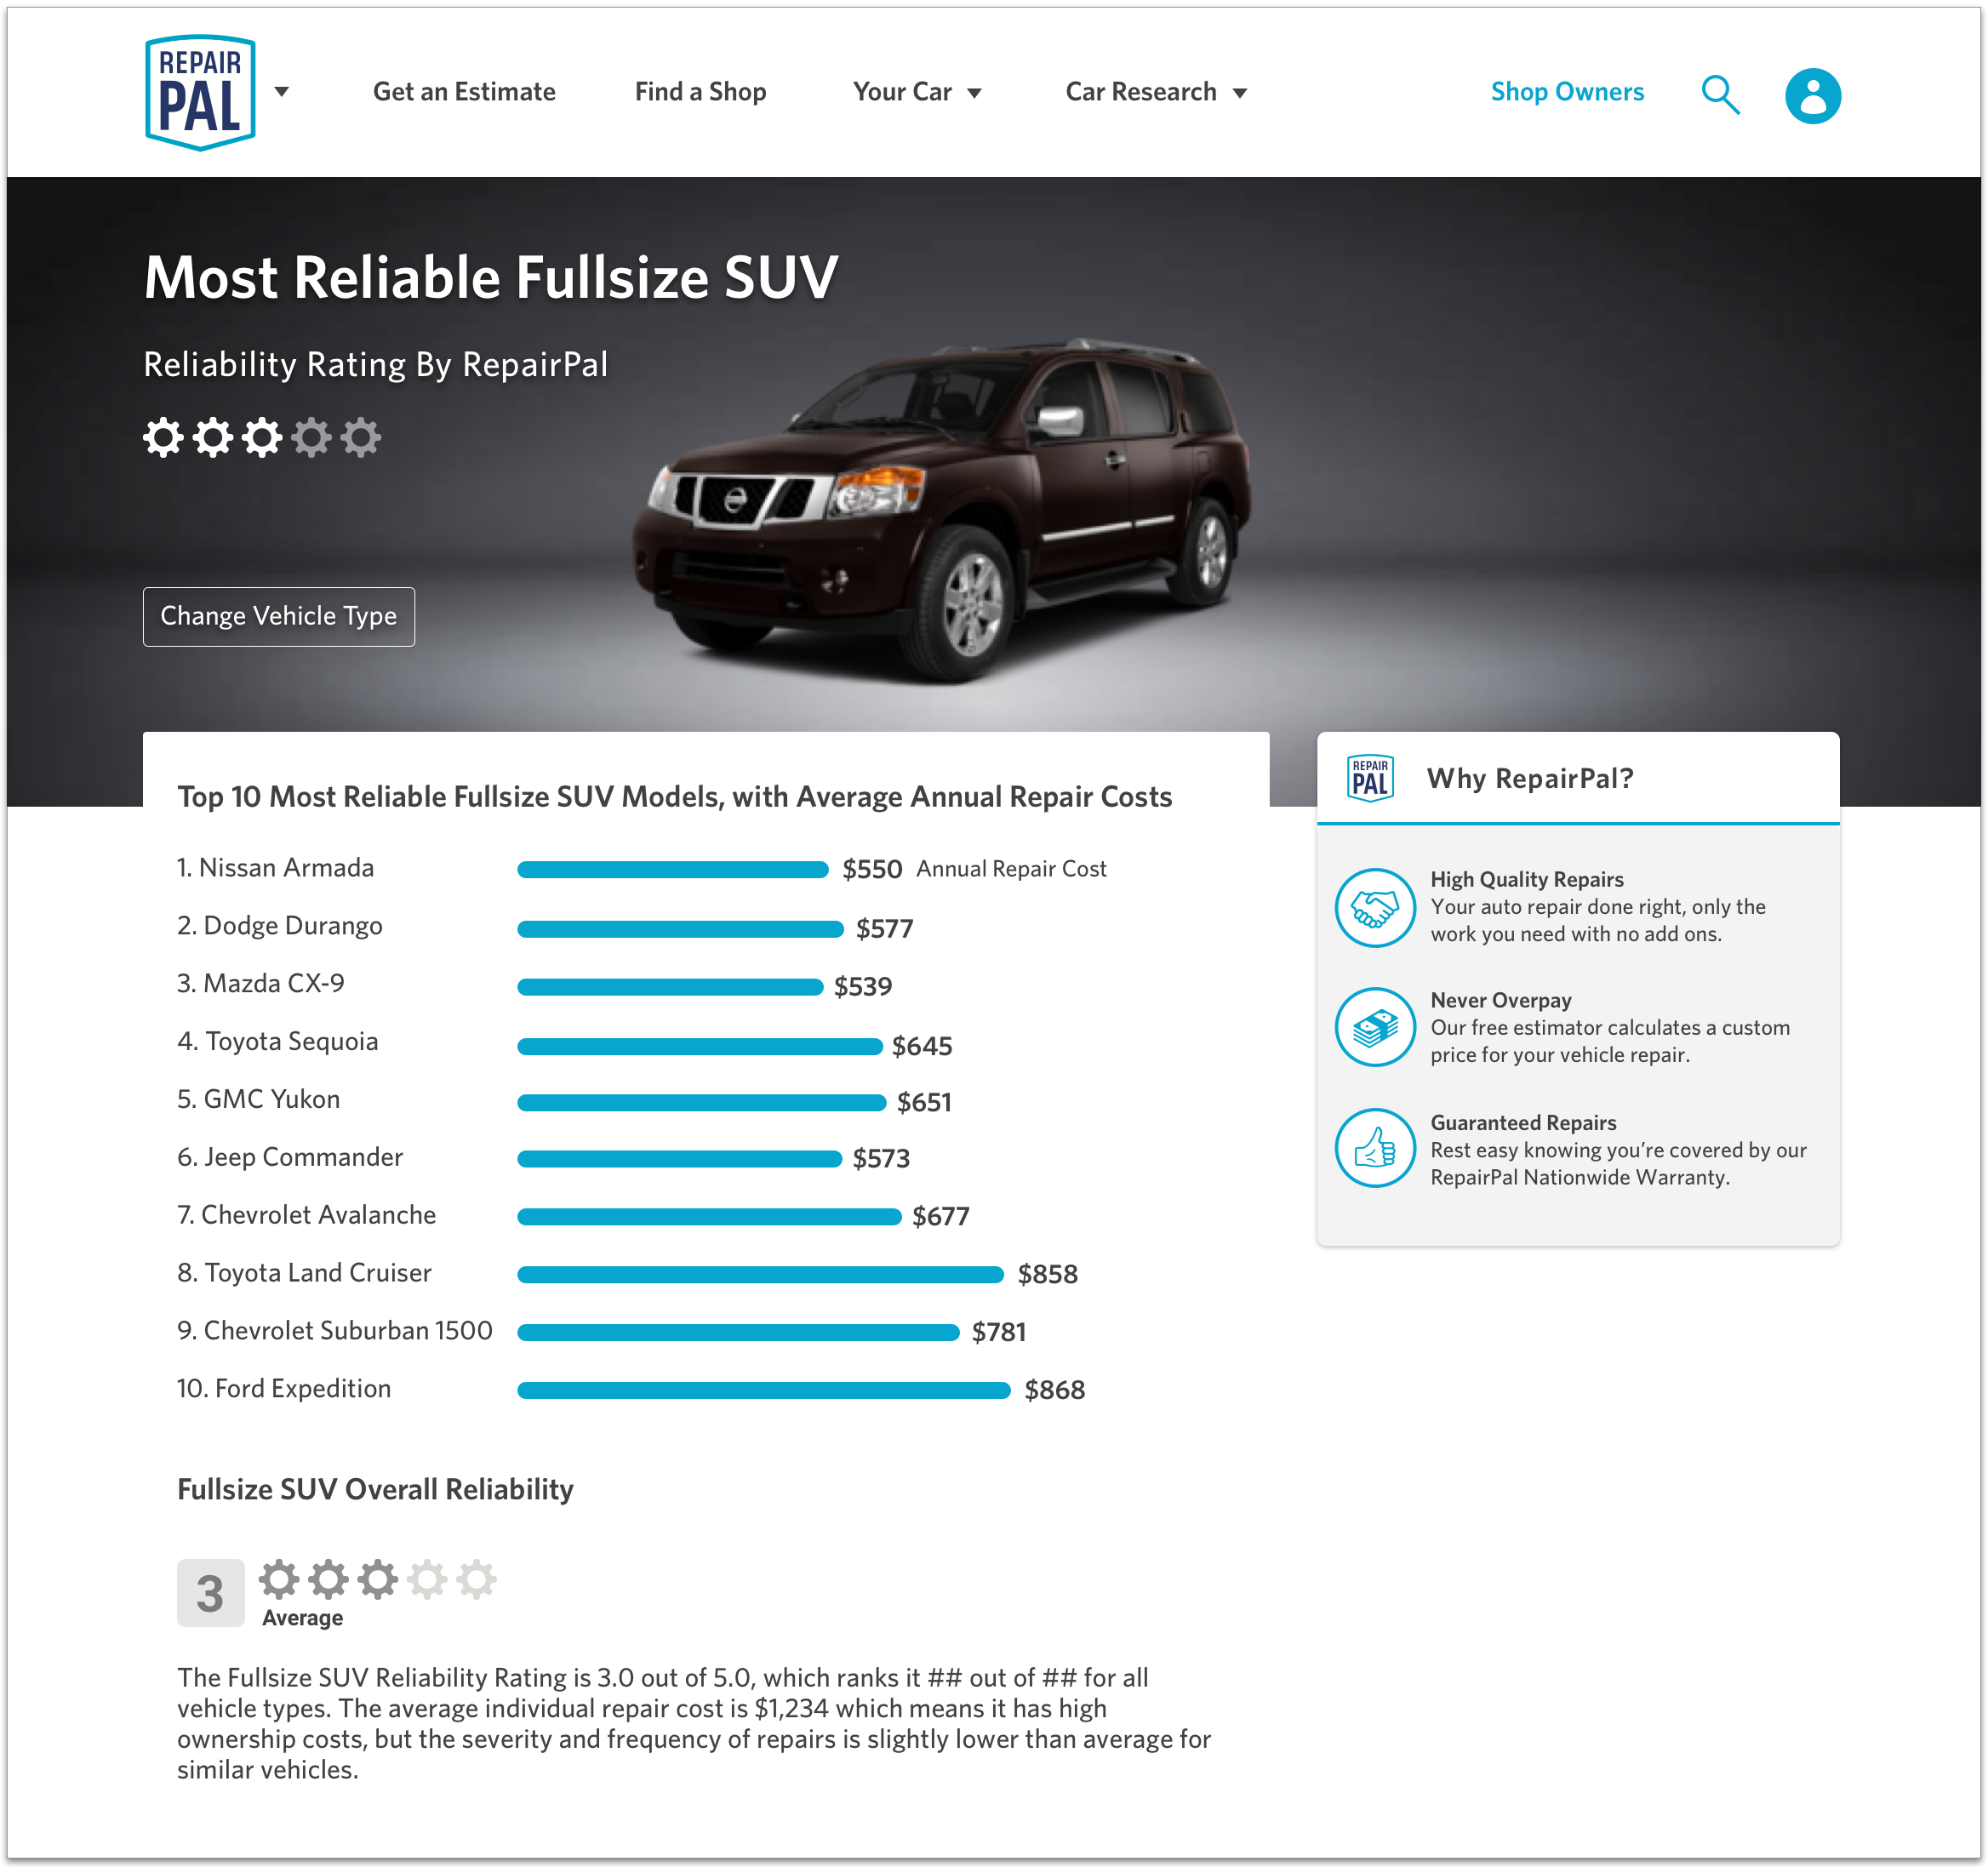
Page types: Make (brand), Segment (car type), Make + Model, Overview/index
(and a special ‘easter egg’ Toyota FJ Cruiser page)
Make + Model Reliability – full desktop mock
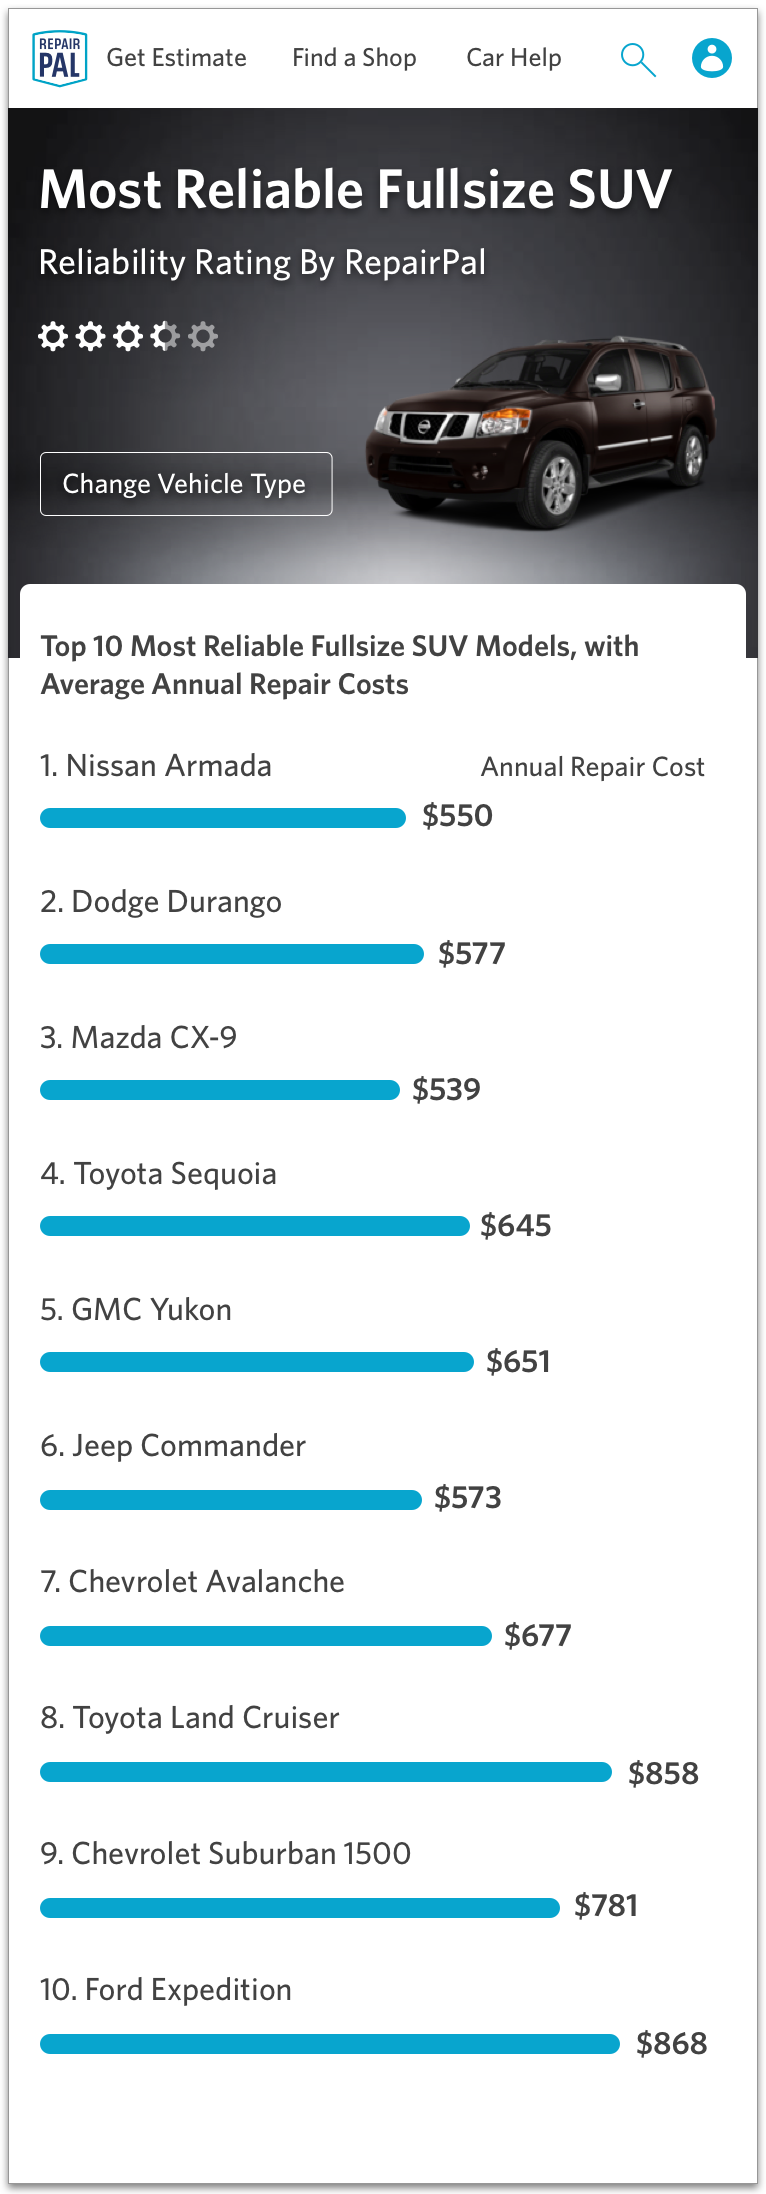
Make + Model – full mobile mock
Landing page overview - mobile
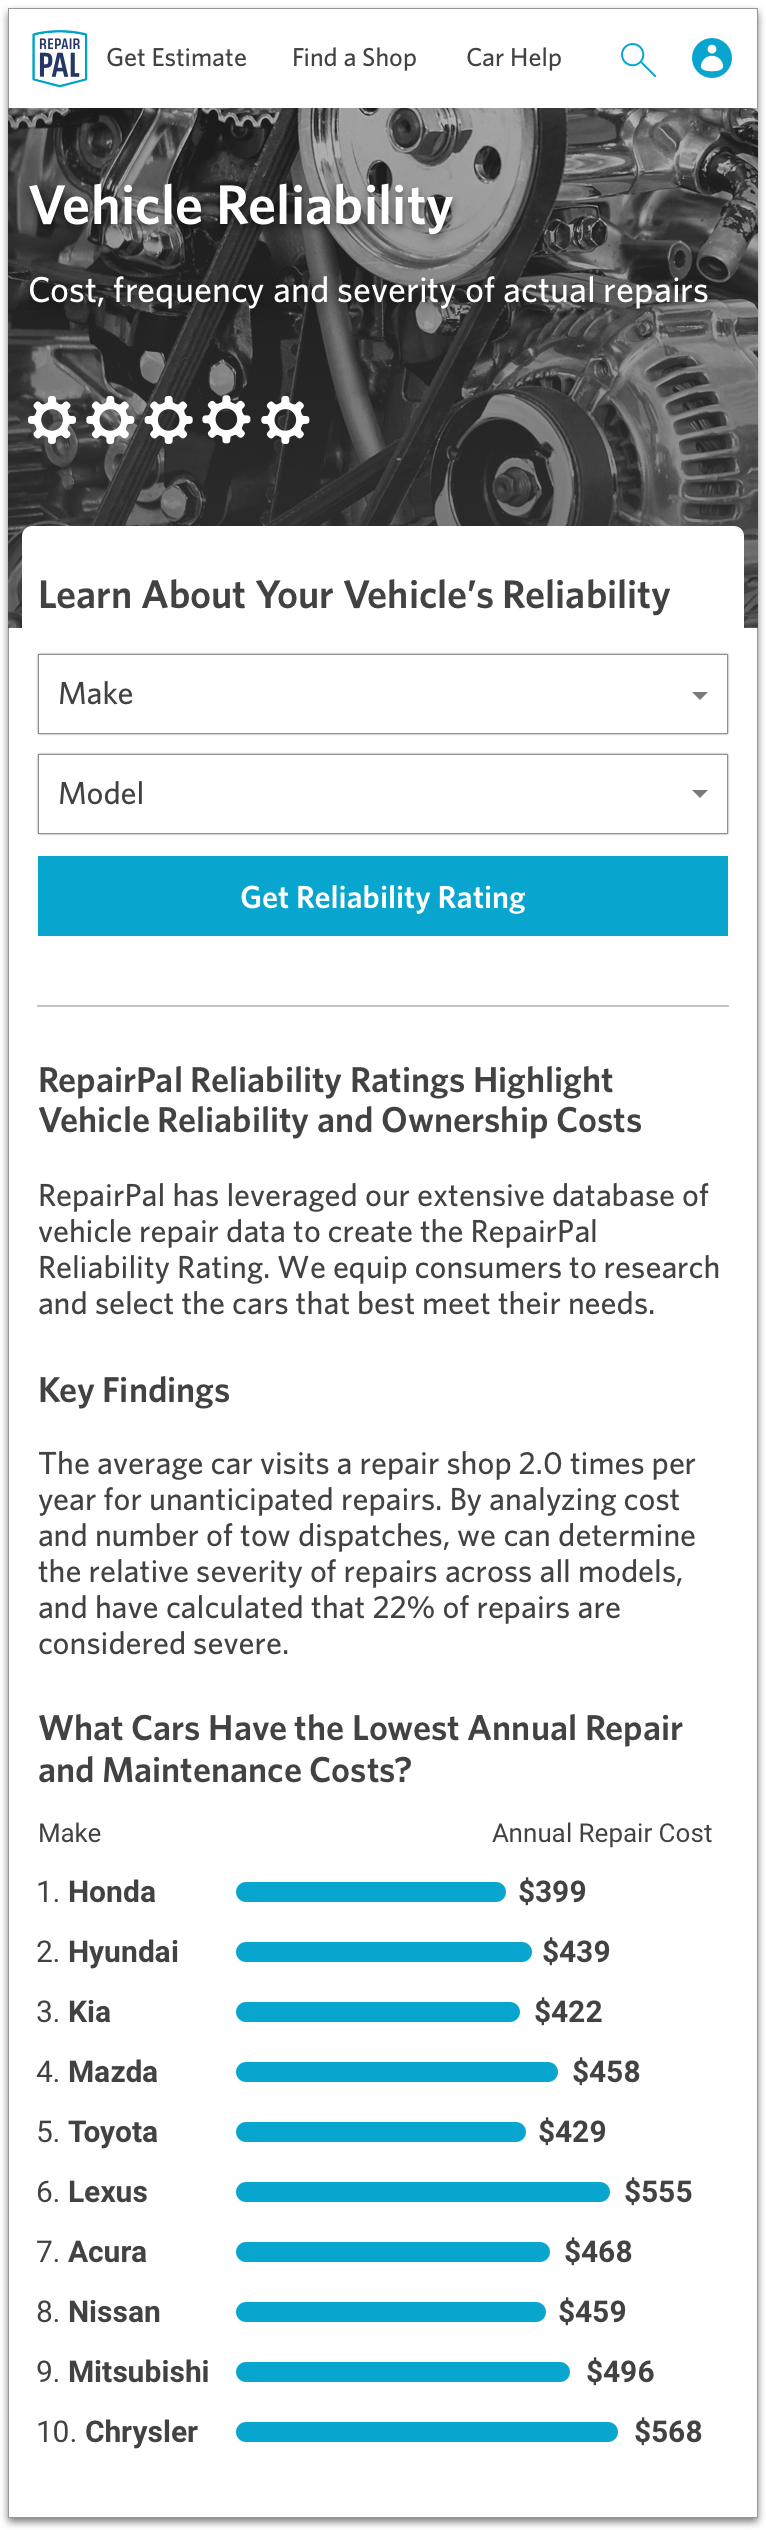
An SEO landing page for general car reliability searches
Landing page top brands - mobile
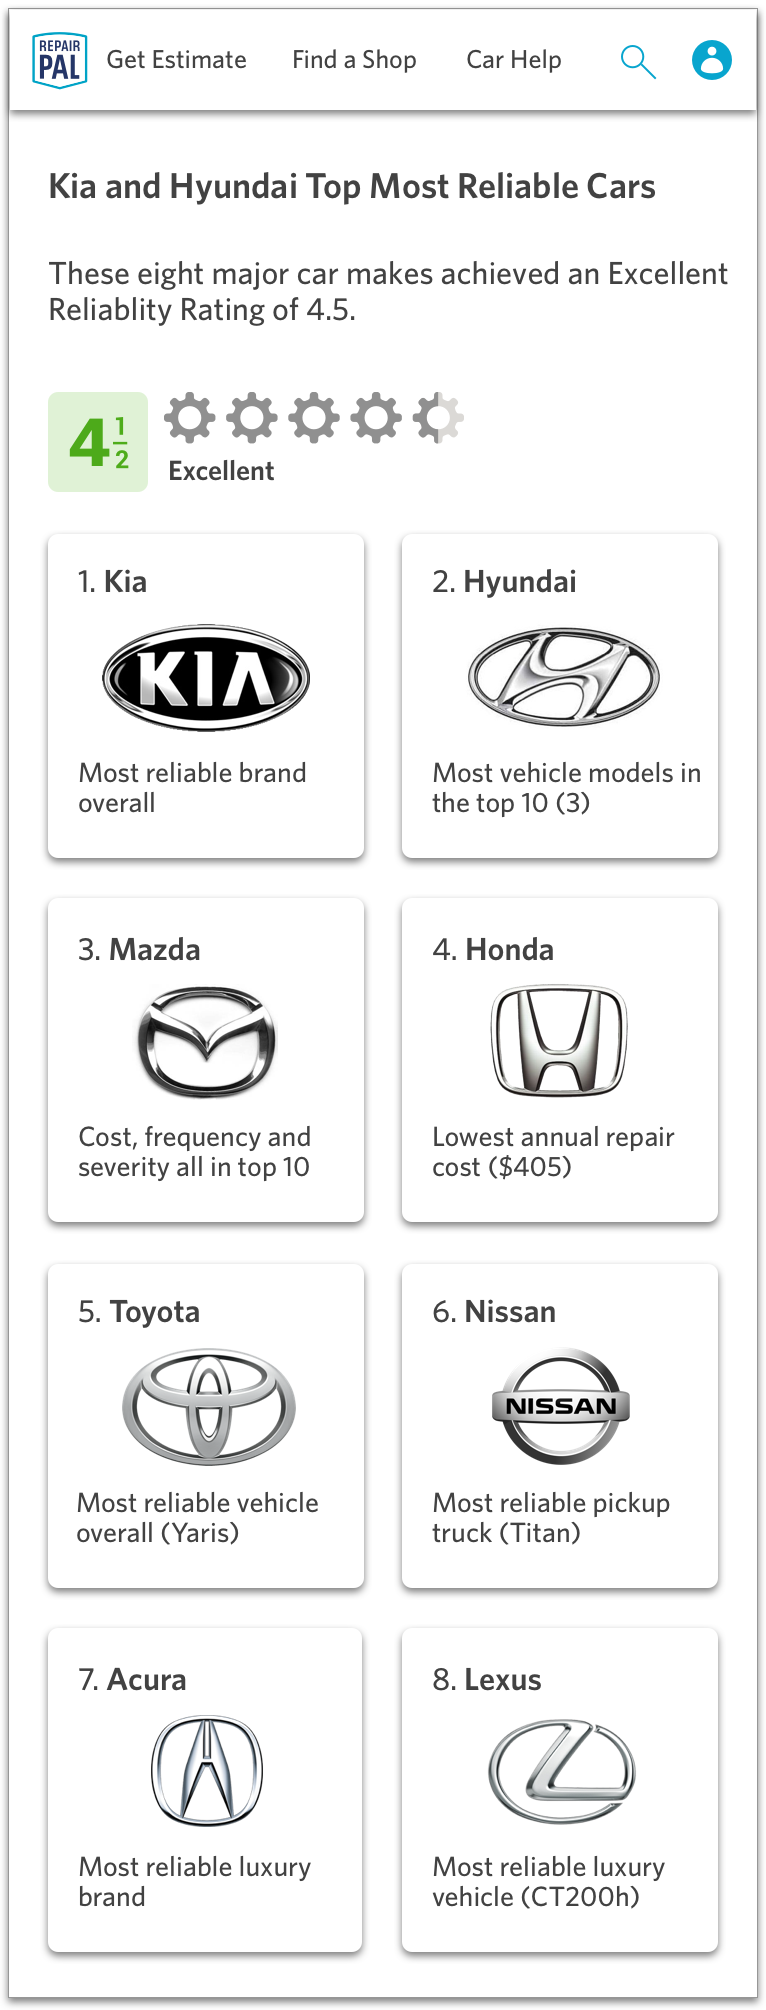
An SEO landing page for most reliable car makes / brands
Make (brand) page - mobile

An SEO landing page for make-only reliability searches, with brand-specific imagery in the hero background at top
‘Easter egg’ FJ Cruiser page
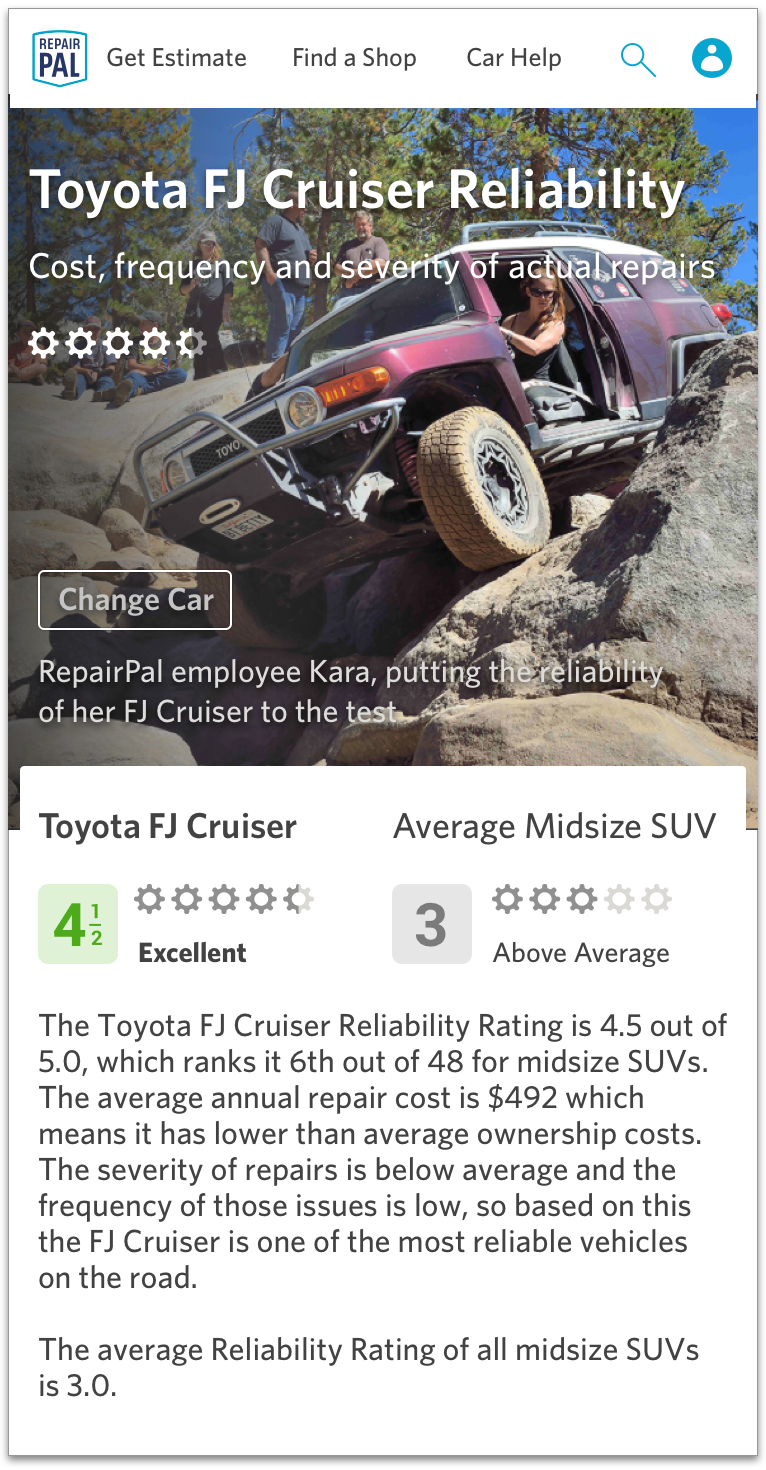
The ‘easter egg’ Make + Model page, a Toyota FJ Cruiser featuring an employee vehicle undergoing “extreme reliability testing”
Segment page (aka car class or type), desktop and mobile designs – an SEO landing page for segment-only (car class/type) reliability searches
Future Product Updates
Planning tools for consumers such as
Most severe repairs to expect for a given model
Repair and cost schedule by year based on vehicle age
Recommended car age at which to sell or trade (in cases of a significant increase in cost, frequency and severity of repairs)